Difference between revisions of "Track Anything Form"
| Line 1: | Line 1: | ||
=='''Anticipating'''== | =='''Anticipating'''== | ||
The Layout Based Visit Form with the G option will plot data points but only 1 point per encounter day. To graph multiple values in the same day and to have more than one graph per encounter, the user must deploy this form. | The Layout Based Visit Form with the G (graphable) option will plot data points but only 1 point per encounter day. To graph multiple values in the same day and to have more than one graph per encounter, the user must deploy this form. | ||
It is particularly useful for plotting parameters with diurnal variations. | |||
Track Anything has other refinements such as order of plotting, multiple views and conglomeration of multi-day graphs. | |||
This form | When the form was first created, it utilized the Procedures Module. Subsequently it has been decoupled from Procedures as explained in [http://sourceforge.net/p/openemr/discussion/202506/thread/83a5d29b/#a2e3 this post]. The reasons for the unlinking were also given in the same thread. | ||
Tracks items can now be configured '''directly''' from the form itself. Procedures configuration is unnecessary. | |||
This form debuted in version 4.2.0. | |||
=='''Adding'''== | =='''Adding'''== | ||
| Line 15: | Line 19: | ||
2. Install the database. | 2. Install the database by clicking "install db". | ||
[[File:2ta1.png|center]] | [[File:2ta1.png|center]] | ||
3. Enable it, name the Category "Clinical" or whatever the user | 3. Enable it, name the Category "Clinical" or whatever the user desires; then click "update". | ||
[[File:3ta1.png|center]] | [[File:3ta1.png|center]] | ||
| Line 28: | Line 32: | ||
2. Select form | 2. Select form. | ||
[[File:5ta1.png|center]] | [[File:5ta1.png|center]] | ||
| Line 43: | Line 47: | ||
5. Configure the second tier. | 5. Configure the second tier. | ||
[[File:9ta1.png|center]] | [[File:9ta1.png|center]] | ||
[[File:10ta1.png|center]] | [[File:10ta1.png|center]] | ||
| Line 51: | Line 55: | ||
6. When all items have been configured, close this part of the module. | 6. Take care to have the value to be graphed in a position ahead of other second tier configurations. In the "Glucose" example, if "Circumstance" appeared on top of "Serum Glucose"; nothing would be plotted. One cannot plot "Had 3 Boston Cream donuts.", because it is not a '''number'''. When all items have been configured, close this part of the module. | ||
[[File:12ta1.png|center]] | [[File:12ta1.png|center]] | ||
| Line 69: | Line 73: | ||
4. Any permutation of 2 or more data points can be graphed. | 4. Any permutation of 2 or more data points can be graphed. Time will be the abscissa, while the parameter value will be the ordinate. | ||
[[File:16ta1.png|center]] | [[File:16ta1.png|center]] | ||
Revision as of 12:53, 27 June 2015
Anticipating
The Layout Based Visit Form with the G (graphable) option will plot data points but only 1 point per encounter day. To graph multiple values in the same day and to have more than one graph per encounter, the user must deploy this form.
It is particularly useful for plotting parameters with diurnal variations.
Track Anything has other refinements such as order of plotting, multiple views and conglomeration of multi-day graphs.
When the form was first created, it utilized the Procedures Module. Subsequently it has been decoupled from Procedures as explained in this post. The reasons for the unlinking were also given in the same thread.
Tracks items can now be configured directly from the form itself. Procedures configuration is unnecessary.
This form debuted in version 4.2.0.
Adding
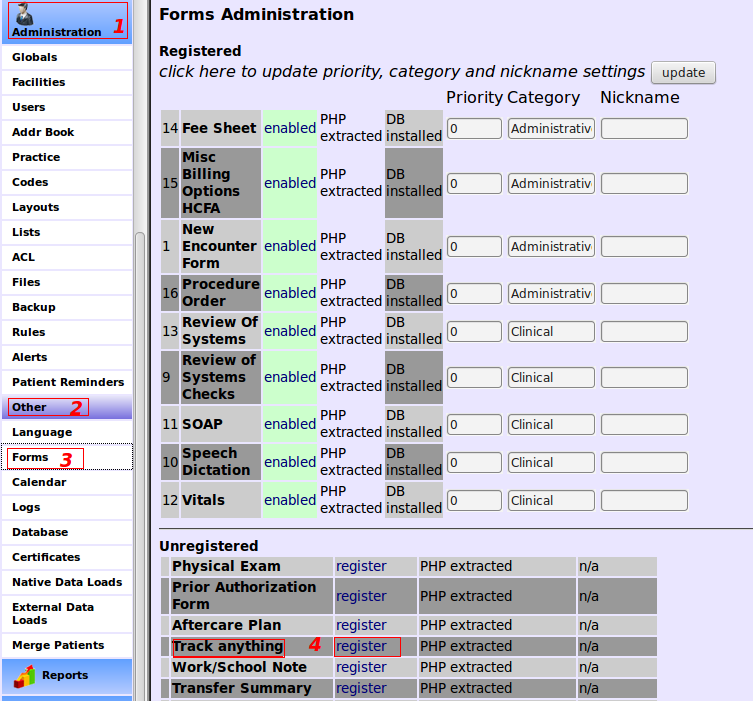
Although 4.2.0 comes preloaded with Track Anything, a series of steps must be undertaken to bring it into service.
1. Register the form.
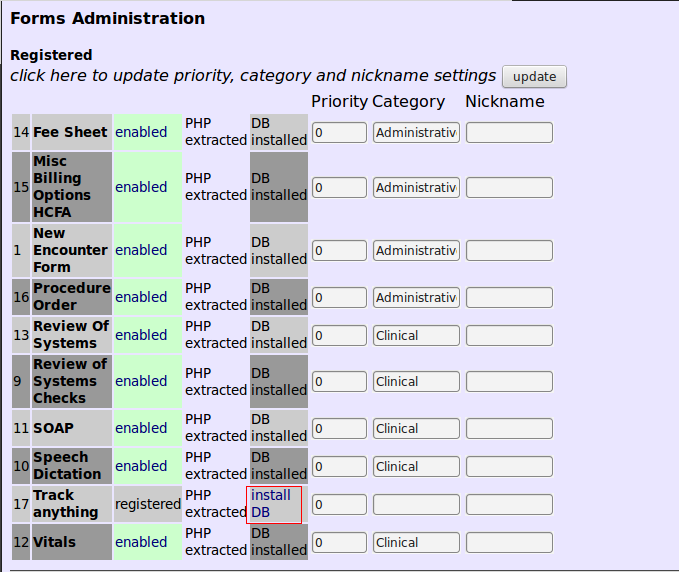
2. Install the database by clicking "install db".
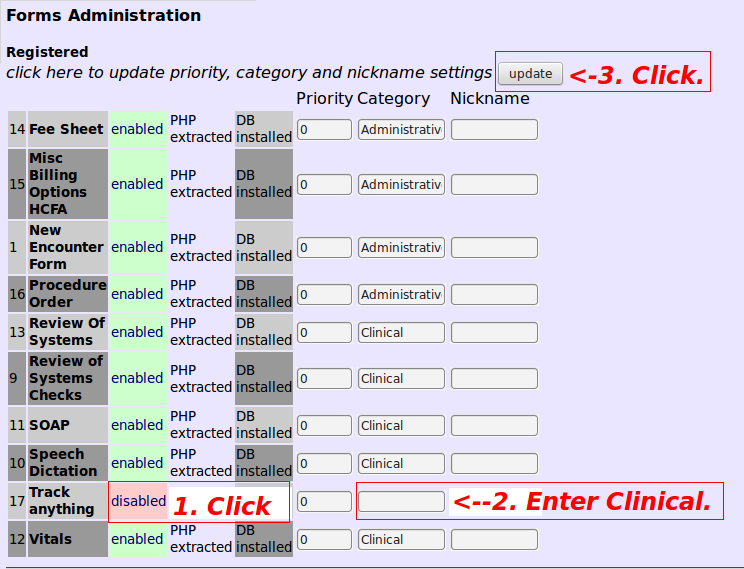
3. Enable it, name the Category "Clinical" or whatever the user desires; then click "update".
Configuring
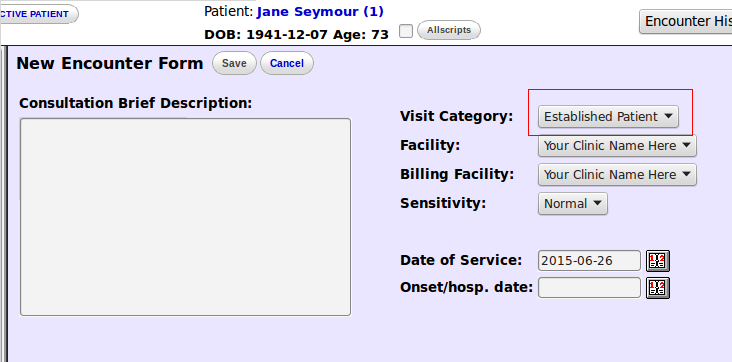
1. Create an encounter.
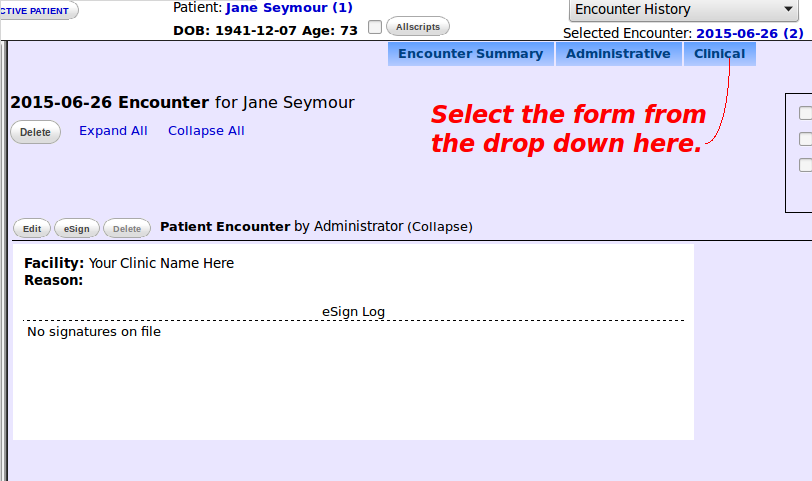
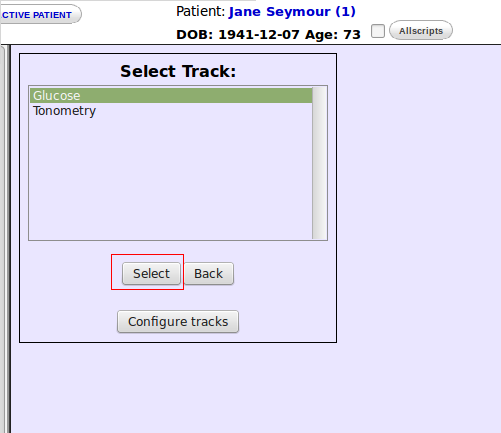
2. Select form.
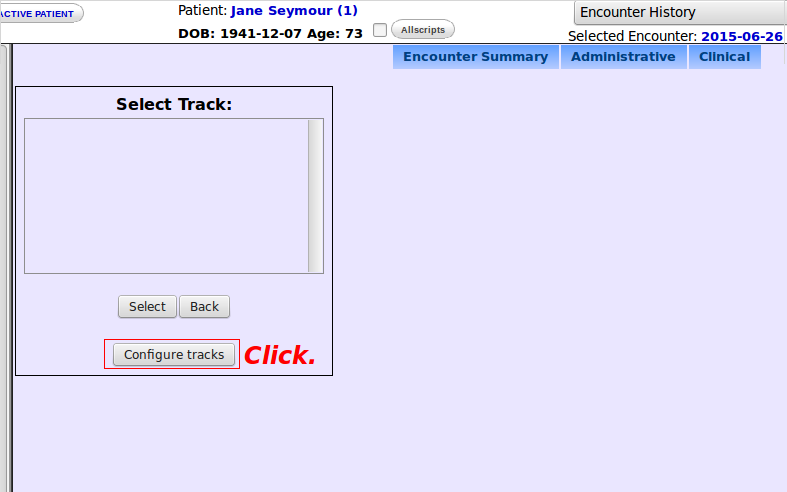
3. Click "Configure tracks".
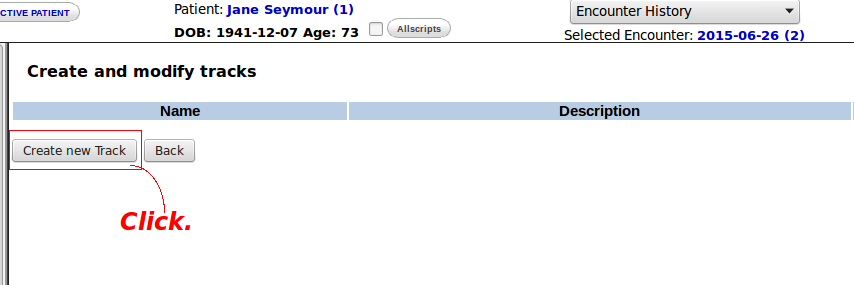
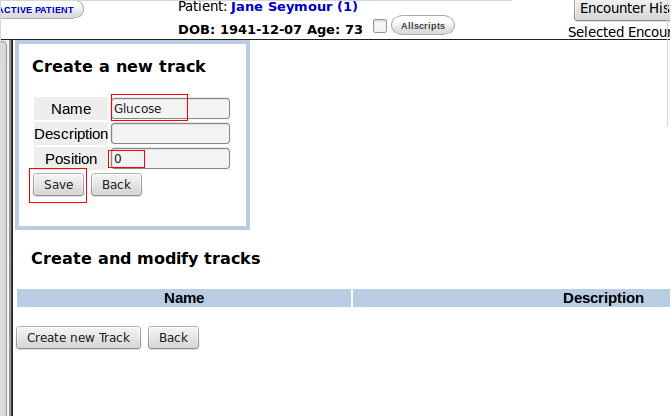
4. Configure the first tier.
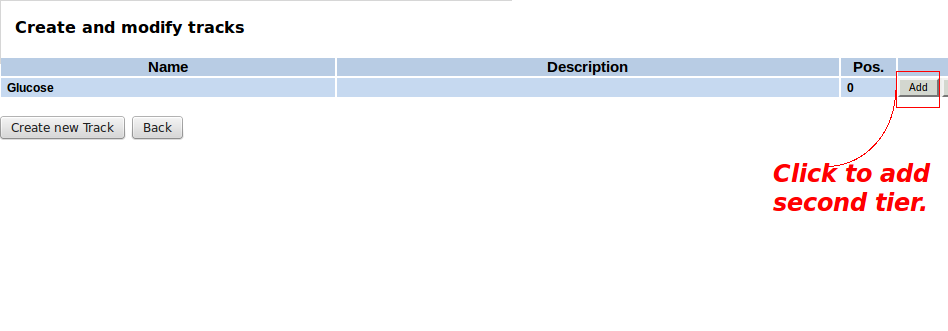
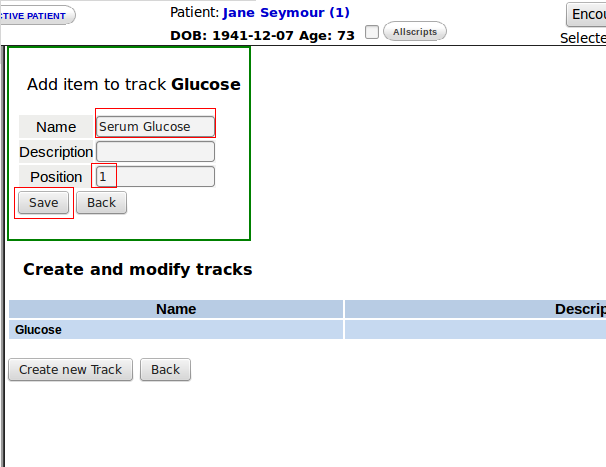
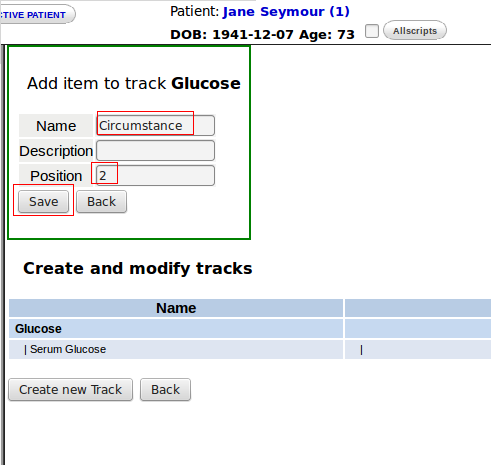
5. Configure the second tier.
6. Take care to have the value to be graphed in a position ahead of other second tier configurations. In the "Glucose" example, if "Circumstance" appeared on top of "Serum Glucose"; nothing would be plotted. One cannot plot "Had 3 Boston Cream donuts.", because it is not a number. When all items have been configured, close this part of the module.
Plotting
1. Select a parameter to graph.
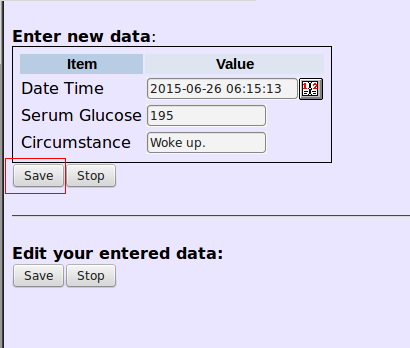
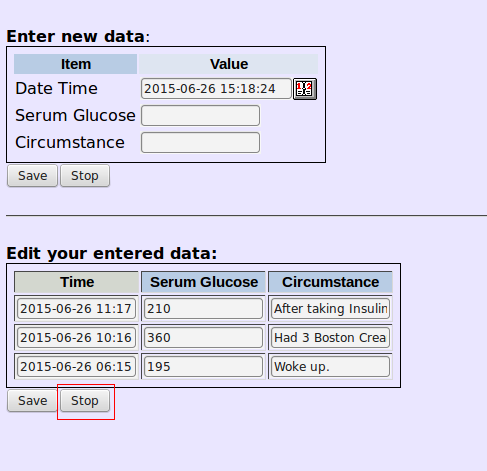
2. After entering time and other data, click "Save".
3. Upon completion, click "Stop".
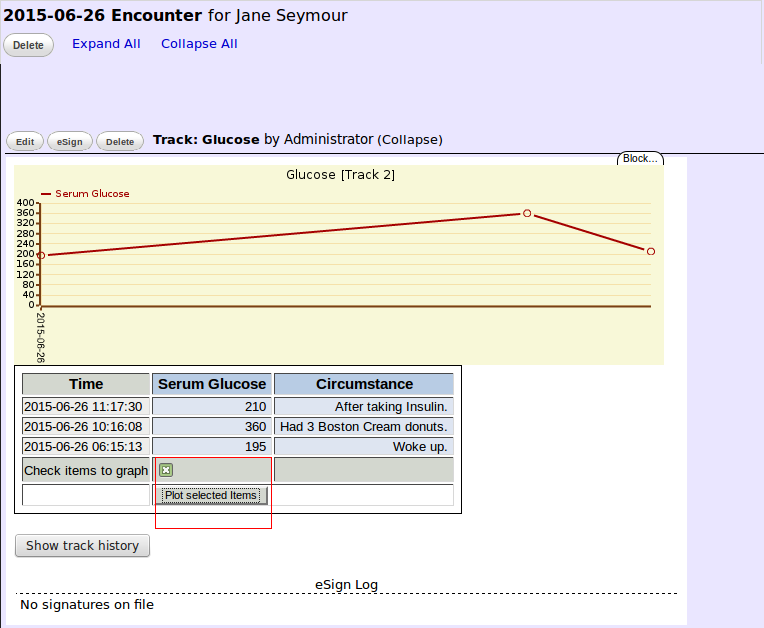
4. Any permutation of 2 or more data points can be graphed. Time will be the abscissa, while the parameter value will be the ordinate.
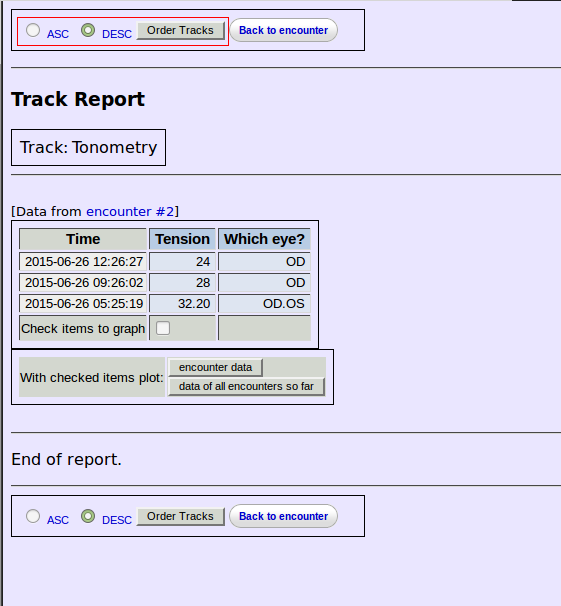
Order of the plots can be changed.
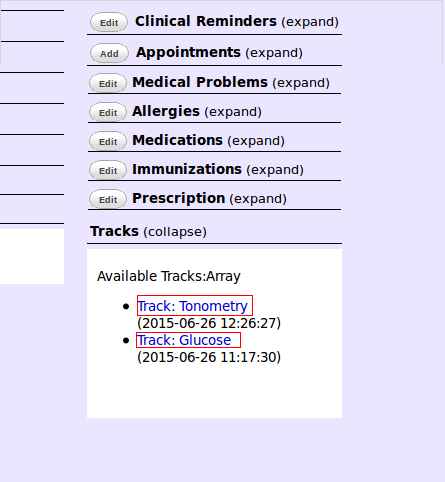
Aside from the Encounter Form, track items can be viewed from the Patient Summary.
Viewing
The first segment of the video refers to Procedures configuration. Skip that obsolete portion by fast-forwarding to frame 1:50 to start the tutorial.
